Graphs
Graphs and coordinates are concepts which are learnt as a way to plot values in a 2D space. It's important to understand that what we plot is actually input and output of functions.
When , the function is defined as . The input is and the output is .
This is nothing but
Slope
A slope is the value between two points after plotting the graph. It's just a fraction between the difference of input values to the difference of output values.
A slope defines the rate of change of output as the input changes. This applies to any 2-dimensional data.
Differential Calculus
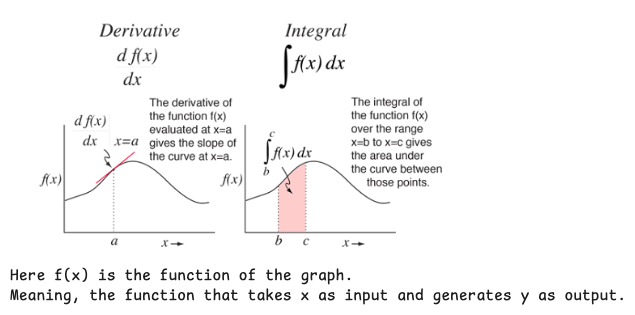
Differential calculus is all about rate of change. Whereas, derivative is a topic within differential calculus which is about the rate of change at a specific point in time.
In a fast moving data, derivative is like a "pause" button to see exactly how fast things are moving at that one split second.
The most important property of a slope is it's always between two points. Whereas, Derivative is the slope at a single point. It's the limit of the slope as the two points get infinitely close to each other.
Understanding derivatives formula
- for a slope between two finite points is .
- for a slope between two infinitely close points is . This is nothing but that takes another function as a parameter.
Integral Calculus
It's about integrating the area under a curve. How slope is between two points, integral is the area between those points.
In case of the bank account interest compounding, the integral between two points shows the actual amount accumulated between two points.
Also in case of travel, derivative shows the speed at the exact point in time, integral shows the distance covered between two points in the graph.
Euler number and derivative
is an exponential logarithm that uses the [Euler's number](./soft-max.mdx#Euler's Number) as the base. The most important feature of this is, the derivative value is always same as the function's output value.
The applies at all data points.